Funnelchart Series Ticks
Series Ticks
![]()
- Click on hamburger icon.
![]()
- Click on dashboard tab and open funnel chart in edit mode.
- The Edit menu box appears as you click on Funnel chart icon. And a widget gets added in content place automatically in dashboard.
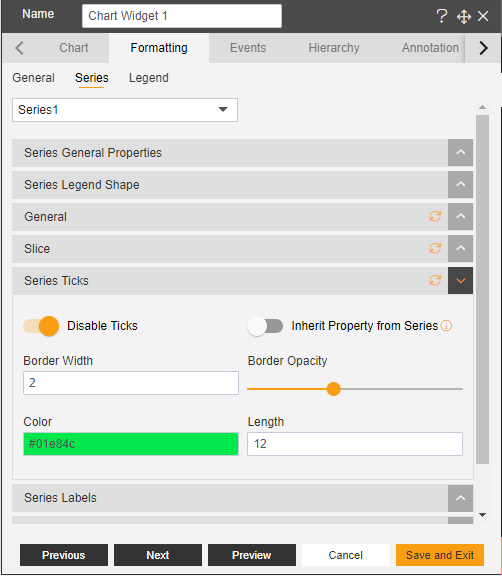
- In Formatting Property click on Series Property.
- Enter Following details in Series Ticks:
- Toggle Enable Ticks
- Border Width: 2
- Color: 01e84c
- Length: 12 Note: Inherit Property from Series toggle-button: it enables user to add the following color of the slice to the slice's ticks.
- Fill above details in edit box, As Shown in figure.
Click on Preview and Save and Exit.
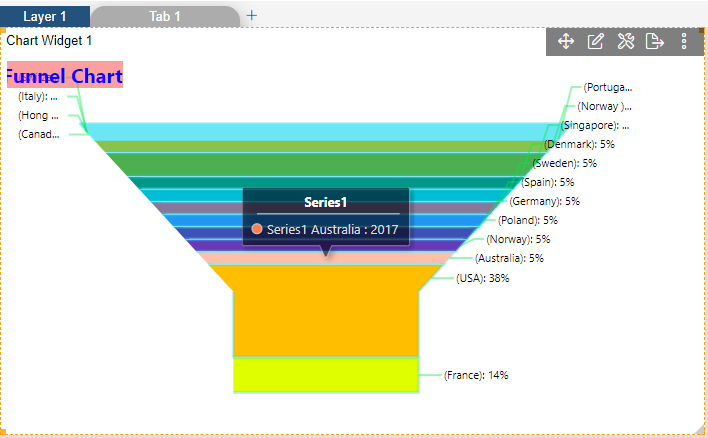
Now, match your Funnel chart with the below example, it should look like the figure below: